Financial Risk Management Framework
Introduction and overview
The Company’s Board of Directors has overall responsibility for the establishment and oversight of the Company’s risk management framework. The Board of Directors has established the Company Integrated Risk Management Committee (IRMC), which is responsible for developing and monitoring Company’s risk management policies.
The Company’s board risk management policies are established to identify and analyse the risks faced by the Company, to set appropriate risk limits and controls, and to monitor risks and adherence to limits.
The risk management policies and systems are reviewed regularly to reflect changes in market conditions and the Company’s activities. The Company, through its training and management standards and procedures, aims to develop a disciplined and constructive control environment in which all employees understand their roles and obligations.
The Company Audit Committee oversees how Management monitors compliance with the Company’s risk management policies and procedures, and reviews the adequacy of the risk management framework in relation to the risks faced by the Company. The Company’s Board Audit Committee is assisted in its oversight role by internal audit division. Internal audit division undertakes both regular and ad hoc reviews of risk management controls and procedures, the results of which are reported to the Company Board Audit Committee.
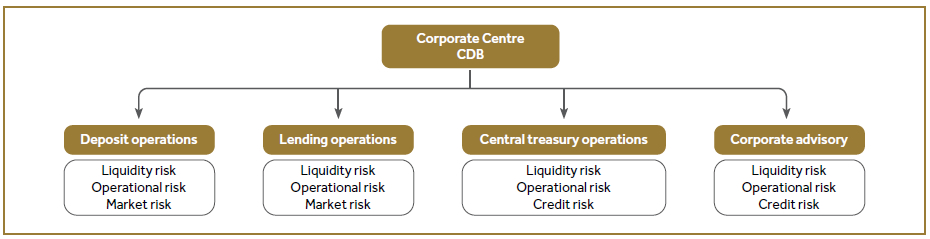
The Company has exposure to the following risks from the financial instruments:
A. Credit risk
B. Liquidity risk
C. Market risk
D. Operational risk
This Note presents the information about the Company’s objectives, policies and processes for measuring and managing risk.
The Impact of COVID-19
On 11 March 2020 World Health Organisation (“WHO”) declared COVID-19 as a global pandemic and since the outbreak continues to spread Sri Lankan Government also resorted to varying levels of public health measures, including movement restrictions, nationwide curfews, travel bans and border closures to tackle the pandemic. These measures are having a huge impact on people’s lives, families and communities whilst having significant consequences on national economies and global trade. Coronavirus disrupts global supply chains, distribution channels and demand. However these data signals a higher possibility of a global recession.
During the period of lockdown and movement restrictions, we ensured to adhere to Government guidelines and directives issued from time to time whilst deploying technology solutions to ensure continuity of the business and also adopting work from home arragements. We continuously engaged with our customers with our digital financial services platform (CDBiNet), our 24X7X365 call centre, ATM access, credit and debit cards and other social media channels to ensure uninterrupted engagement with our customers and other connected parties during the curfew period.
The government and the Central bank decided to introduce number of relief measures to support businesses and individuals affected by the outbreak of COVID-19 which includes deferment of repayment terms under debt moratorium, offering concessionary interest rates to eligible loan products and waiving off certain fees and charges. On the other hand Central Bank of Sri Lanka (CBSL) decided to introduce number of measures to provide flexibility to NBFIs including relaxation of regulatory requirements as well.
Accordingly the Company has taken all the relief measures in line with the directives issued by Central Bank of Sri Lanka.
Future outlook and going concern
According to Fitch Ratings Lanka Limited the coronavirus outbreak and the resultant prolonged business disruptions will put additional pressure and bring multiple challenges on Sri Lankan finance and leasing companies’ (FLCs) in terms of profitability, asset quality, muted loan growth, margin compression and lower interest rates, and rising loan-impairment charges due to asset-quality pressures. The ultimate economic and financial market implications of the outbreak are unclear and estimating the exact impact COVID-19 is a challenge. Simply, there are too many unknowns such as rate of infection and immunity, policy response, demand-supply dynamics, reaction of firms etc. However, with the support of Company’s Enterprise Risk Management Framework the Company is proactively analysing various possible scenarios in a more descriptive manner.
During the preparation of financial statements for the year ended 31 March 2021 management has made an assessment of an entity’s ability to continue as a going concern using the all available information about the future and capturing the current economic uncertainties and market volatility caused by the COVID-19 outbreak. When making that assessment, management considered the existing and anticipated effects of the COVID-19 outbreak on the entity’s business activities considering the measures taken by the government and central bank to provide relief to affected entities and relaxation of regulatory requirements. During this exercise Management has paid special attention to below factors
- Management has used best estimates to identify the risk factors in different possible outcomes in current economic uncertainty and market volatility caused by the COVID-19 outbreak
- Evaluation of plans to mitigate events or conditions that may cast significant doubt on the entity’s ability to continue as a going concern.
- Assessment of the availability of finance and ensure these plans are achievable and realistic despite of having difficulties in collections of dues and the difficulties in getting funding lines from banks and other financial institutions. Based on the assessment conducted it was concluded that the Company was able to maintain a stable liquidity position and safeguard the interest of the stakeholders.
The Company has made the assessment of going concern considering a wide range of factors in multiple scenarios such as best case, most likely and worst case. The major factors include retention and renewal of deposits, relaxation of regulatory aspects, profitability based on income and cost management projections, excess liquidity, strengthening recovery actions, undrawn loan facilities and potential funding lines.
Having evaluated the above by the Management concludes that the Company has adequate resources to continue as a going concern and the Company is monitoring the impacts on its operations arising in post COVID environment.
Financial reporting impact due to COVID-19
Guidance notes on accounting considerations of the COVID-19 outbreak issued by Institute of Chartered Accountants of Sri Lanka (CA Sri Lanka) had provided following measures which have been applied in preparation of comparative financial statements as at 31 March 2020;
Expected credit loss assessment
Company has used Probability of Default (PD), Loss Given Default (LGD) and Economic Factor Adjustment computed in 31 December 2019 to assess the expected credit losses as at 31 March 2020 due to uncertainties and lack of sufficient information available to make any adjustments to factor the impact of COVID-19. However the Company has increased the weightage assigned to worst case scenario as at 31 March 2020 to capture potential impact of COVID-19.
Reclassification of debt and equity portfolios
As per the guidelines issued by CA Sri Lanka a one off option has provided to reclassify equity portfolio as at 1 January 2020. Accordingly the Company has reclassified equity portfolio held under fair value through profit or loss to fair value through other comprehensive income.
Fair value measurement of Financial Assets
As per the guidelines issued by CA Sri Lanka and the provisions in SLFRS 13 – Fair value measurement, there is an impossibility to derive the fair value of financial assets as at 31 March 2020 due to unavailability of reliable information and distress prices. Accordingly alternative valuation technique was used when determining the market prices of equity securities as at 31 March 2020.
New measures taken by the Company under risk management consideration due to the impact of COVID-19 is disclosed in the Note 51 to the Financial Statements.
A. CREDIT RISK
“Credit risk” is the risk of financial loss to the Company if a customer or counterparty to a financial instrument fails to meet its contractual obligations, and arises principally from the Company’s loans and receivables to customers and other banks, and investment debt securities. For risk management reporting purposes, the Company considers and consolidates all elements of credit risk including contingent or potential credit exposure (such as individual obligor default risk, country and sector risk).
The market risk in respect of changes in value in trading assets arising from changes in market credit spreads is managed as a component of market risk; for further details,see (C) below.
The COVID-19 has caused interruptions in economic activities and this has caused financial stress among our lending customers in the short term. Management has already granted debt moratoriums and other reliefs for affected customers as per CBSL directions and have strengthened the recovery process to ensure customers who were not affected by COVID-19 are paid their dues in regular manner.
Management has already identified some economic segments like tourism and apparel which are badly affected and the Company is comfortable with the
existing sector concentration and will avoid accumulation of exposures to risky economic sectors.
i. Settlement risk
The Company’s activities may give rise to risk at the time of settlement of transactions and trades. “Settlement risk” is the risk of loss due to the failure of an entity to honour its obligation to deliver cash, securities or other assets as contractually agreed.
For certain types of transactions, the Company mitigates this risk by conducting settlements through a settlement/clearing agent to ensure that a trade is settled only when both parties have fulfilled their contractual settlement obligations. Settlement limits form part of the credit approval/limit monitoring process described earlier. Acceptance of settlement risk on free-settlement trades requires transaction-specific or counterparty-specific approvals from the Company risk committee.
ii. Management of credit risk
The principal objective of risk management is to maintain strong risk culture across the Company which is responsible for leading and robust risk policies and control framework to reinforcement and challenge in defining, implementing and controlling evaluating our risk appetite under both actual and simulated scenarios and to establish independent evaluation of cost and their mitigation.
In order to achieve this the Board of Directors has delegated responsibility for the oversight of credit risk of the Company to Delegated Credit Committee (DCC).
A separate Credit evaluation department, reporting to the Company Credit Committee, is responsible for managing the Company’s credit risk, including the following:
- Formulating credit policies in consultation with business units, covering collateral requirements, credit assessment, risk grading and reporting, documentary and legal procedures, and compliance with regulatory and statutory requirements.
- Establishing the authorisation structure for the approval and renewal of credit facilities. Authorisation limits are allocated to business unit Credit Officers. Larger facilities require approval by Company credit, the Head of Company credit, the Company Credit Committee or the Board of Directors as appropriate.
- Reviewing and assessing credit risk: Company Credit Committee assesses all credit exposures in excess of designated limits, before facilities are committed to customers by the business unit concerned. Renewals and reviews of facilities are subject to the same review process.
- Limiting concentrations of exposure to counterparties, geographies and industries (for loans and receivables, financial guarantees and similar exposures), and by issuer, credit rating band, market liquidity and country (for investment securities).
- Reviewing compliance of business units with agreed exposure limits, including those for selected industries, country risk and product types. Regular reports on the credit quality of local portfolios are provided to Company Credit Committee, which may require appropriate corrective action to be taken.
- Providing advice, guidance and specialist skills to business units to promote best practice throughout the Company in the management of credit risk.
Company is required to implement Company credit policies and procedures, with credit approval authorities delegated from the Company Credit Committee. Each business unit has a Chief Credit Risk Officer who reports on all credit-related matters to local management and the Company Credit Committee. Each business unit is responsible for the quality and performance of its credit portfolio and for monitoring and controlling all credit risks in its portfolios, including those subject to central approval.
Regular audits of business units and Company credit processes are undertaken by internal audit.
B. LIQUIDITY RISK
“Liquidity risk” is the risk that the Company will encounter difficulty in meeting obligations associated with its financial liabilities that are settled by delivering cash or another financial asset.
i. Management of liquidity risk
The objective of the Company’s liquidity risk management framework is to ensure that the Company can fulfill its payment obligations at all times and can manage liquidity and funding risk within risk appetite.
The Company’s Board of Directors sets the Company’s strategy for managing liquidity risk and delegates responsibility for oversight of the implementation of this policy to Asset and Liability Committee (ALCO). ALCO approves the Company’s liquidity policies and procedures. Treasury manages the Company’s liquidity position on a day-to-day basis and reviews daily reports covering the liquidity position of both the Company and operating subsidiaries. A summary report, including any exceptions and remedial action taken, is submitted regularly to ALCO.
The Company’s approach to managing liquidity is to ensure, as far as possible, that it will always have sufficient liquidity to meet its liabilities when they are due, under both normal and stressed conditions, without incurring unacceptable losses or risking damage to the Company’s reputation.
The key elements of the Company’s liquidity strategy are as follows:
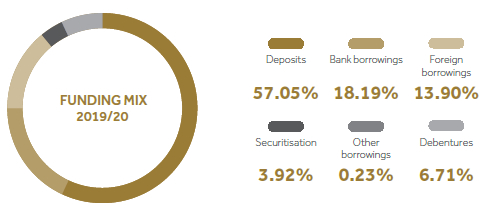
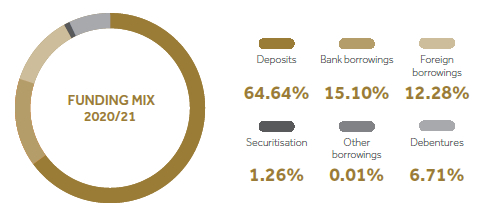
- Maintaining a diversified funding base consisting of customer deposits (both retail and corporate) and wholesale market deposits and maintaining contingency facilities.
- Carrying a portfolio of highly liquid assets, diversified by currency and maturity.
- Monitoring liquidity ratios, maturity mismatches, behavioural characteristics of the Company’s financial assets and financial liabilities, and the extent to which the Company’s assets are encumbered and so not available as potential collateral for obtaining funding.
- Carrying out stress testing of the Company’s liquidity position.
Central Treasury receives information from other business units regarding the liquidity profile of their financial assets and financial liabilities and details of other projected cash flows arising from projected future business. Central Treasury then maintains a portfolio of short-term liquid assets, largely made up of short-term liquid investment securities, loans and advances to banks and other inter-bank facilities, to ensure that sufficient liquidity is maintained within the Company as a whole. The liquidity requirements of business units and subsidiaries are met through loans from Central Treasury to cover any short-term fluctuations and longer-term funding to address any structural liquidity requirements.
If an operating subsidiary or branch is subject to a liquidity limit imposed by its local regulator, then the subsidiary or branch is responsible for managing its overall liquidity within the regulatory limit in coordination with Central Treasury. Central Treasury monitors compliance of all operating subsidiaries with local regulatory limits on daily basis.
Regular liquidity stress testing is conducted under a variety of scenarios covering both normal and more severe market conditions. The scenarios are developed taking into account both Company specific events (e.g., a rating downgrade) and market-related events (e.g., prolonged market illiquidity, reduced fungibility of currencies, natural disasters or other catastrophes).
With COVID-19 pandemic, the Company has established more firm process to manage liquidity with the close supervision of Assets and Liability Management Committee (ALCO). Company closely monitoring the latest impact arsing in post COVID environment and continued to keep its risk management measures to respond these changing circumstances. The Company is comfortable with its existing buffer of liquid assets and funding lines available at the moment. ALCO closely monitors asset liability compositions ongoing basis to response any resulting risk while mitigating any adverse effect.
C. Market Risk
“Market risk” is the risk that changes in market prices – such as interest rates, equity prices, foreign exchange rates and credit spreads (not relating to changes in the obligor’s/issuer’s credit standing) – will affect the Company’s income or the value of its holdings of financial instruments.
i. Management of market risk
The objective of the Company’s market risk management is to manage and control market risk exposures within acceptable parameters to ensure the Company’s solvency while optimising the return on risk.
Overall authority for market risk is vested in ALCO. ALCO sets up limits for each type of risking aggregate and for portfolios, with market liquidity being a primary factor in determining the level of limits set for trading portfolios. The Company Market Risk Committee is responsible for the development of detailed risk management policies (subject to review and approval by ALCO) and for the day-to-day review of their implementation.
ii . Exposure to market risk
The principal risk to which portfolios are exposed is the risk of loss from fluctuations in the future cash flows or fair values of financial instruments because of a change in market interest rates. Interest rate risk is managed principally through monitoring interest rate gaps and by having pre-approved limits for repricing bands. ALCO is the monitoring body for compliance with these limits and is assisted by Central Treasury in its day-to-day monitoring activities. Equity price risk is subject to regular monitoring by Company market risk, but is not currently significant in relation to the overall results and financial position of the Company. In respect of foreign currency, the Company monitors any concentration risk in relation to any individual currency with regard to the translation of foreign currency transactions and monetary assets and liabilities into the functional currency of the Company.
D. Operational Risk
“Operational risk” is the risk of direct or indirect loss arising from a wide variety of causes associated with the Company’s processes, personnel, technology and infrastructure, and from external factors other than credit, market and liquidity risks, such as those arising from legal and regulatory requirements and generally accepted standards of corporate behaviour. Operational risks arise from all of the Company’s operations.
The Company’s objective is to manage operational risk so as to balance the avoidance of financial losses and damage to the Company’s reputation with overall cost effectiveness and innovation. In all cases, Company policy requires compliance with all applicable legal and regulatory requirements.
The Board of Directors has delegated responsibility for operational risk to its Company Operational Risk Committee, which is responsible for the development and implementation of controls to address operational risk.
This responsibility is supported by the development of overall Company standards for the management of operational risk in the following areas:
- Requirements for appropriate segregation of duties, including the independent authorisation of transactions;
- Requirements for the reconciliation and monitoring of transactions;
- Compliance with regulatory and other legal requirements;
- Documentation of controls and procedures;
- Requirements for the periodic assessment of operational risks faced, and the adequacy of controls and procedures to address the risks identified;
- Requirements for the reporting of operational losses and proposed remedial action;
- Development of contingency plans;
- Training and professional development;
- Ethical and business standards; and
- Risk mitigation, including insurance where this is cost effective.
Compliance with Company standards is supported by a programme of periodic reviews undertaken by internal audit. The results of internal audit reviews are discussed with the Company Operational Risk Committee, with summaries submitted to the Audit Committee and Senior Management of the Company.
Interest rates due to COVID-19 outbreak
The Management of the Company is closely analysing the impact on net interest margin resulting from relief measures announced by CBSL to support businesses and individuals affected due to COVID-19 outbreak.
Exchange rates due to COVID-19 outbreak
The Sri Lankan Rupee recorder a sharp depreciation against the US Dollar in March 2021 after the pandemic management analyses the impact on foreign exchange movement on regular basis.
Equity prices due to COVID-19 outbreak
The economic fallout and closure of the share market due to COVID-19 pandemic resulted in dynamic changes in share market indexes. However, indexes are gradually recovering and management is monitoring the equity price movements on regular basis.
Integrated risk management division
Primarily, business divisions and respective risk owners are responsible for risk management. The risk management division acts as the Second Line of Defence in managing the risks faced by the Company. Division has taken leadership in building a strong risk culture which is embedded through clear and consistent communication and appropriate training for all employees. Chief Risk Officer reports risk identified through robust risk reporting tool, risk measurement techniques, stress testing and other risk measures to the Corporate Management Team.
Financial risk review of the Company
This presents information about the Company’s exposure to financial risks and the Company’s management of capital.
|
Page |
| A. Credit risk |
|
| i. Credit quality analysis |
227 |
| ii. Impaired financial instruments |
234 |
| iii. Collateral held and other credit enhancements |
235 |
| iv. Concentration of credit risk |
235 |
| v. Offsetting financial assets and liabilities |
238 |
| B. Liquidity risk |
|
| i. Exposure to liquidity risk |
238 |
| ii. Maturity analysis for financial assets and liabilities |
239 |
| iii. Liquidity reserves |
239 |
| iv. Financial assets available for future funding |
240 |
| C. Market risk |
|
| i. Exposure to market risk |
241 |
| ii. Value at risk (VaR) |
242 |
| iii. Exposure to interest rate risk |
243 |
| iv. Exposure to currency risk |
244 |
| v. Exposure to equity price risk |
245 |
| vi. Exposure to gold price risk |
246 |
| vii. Exposure to Government security price risk |
247 |
| D. Capital management |
|
| i. Capital adequacy ratio |
248 |
| ii. Capital allocation |
248 |
A. Credit risk
A.I Credit quality analysis
The tables below sets out information about the credit quality of financial assets held by Company net of allowance for expected credit losses against those assets.
Expected Credit Losses (ECL)
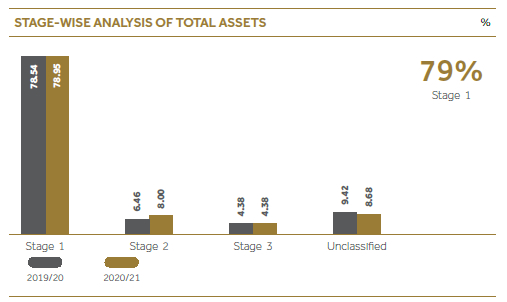
As per SLFRS 9 – “Financial Instruments” the Company manages credit quality using a three stage approach.
Stage One |
: |
12 months expected credit losses (ECL) |
Stage Two |
: |
Life time expected credit losses (ECL) – Not credit impaired |
Stage Three |
: |
Lifetime expected credit losses (ECL) – Credit impaired |
Stage 1:12 months ECL
For exposures where there has not been a significant increase in credit risk since initial recognition, the portion of the lifetime ECL associated with the probability of default events occurring within next 12 months from the reporting date is recognised.
Stage 2: Lifetime ECL – Not credit impaired
For credit exposures where there has been a significant increase in credit risk since initial recognition but that are not credit impaired, a lifetime ECL is recognised.
Stage 3: Lifetime ECL – Credit impaired
Financial assets are assessed as credit impaired when one or more events that have a detrimental impact on the estimated future cash flows of that asset have occurred.
Table below shows the classification of assets and liabilities based on the above-mentioned three stage model:
|
Note |
12 months ECL
Rs. ’000 |
Life Time ECL –
Not credit impaired
Rs. ’000 |
Life time ECL –
Credit impaired
Rs. ’000 |
Unclassified
Rs. ’000 |
Total
Rs. ’000 |
| As at 31 March 2021 |
|
|
|
|
|
|
| Cash and cash equivalents |
20 |
2,090,509 |
|
|
|
2,090,509 |
| Financial assets measured at FVTPL |
21 |
160,639 |
|
|
|
160,639 |
| Derivative financial assets |
|
198,046 |
|
|
|
198,046 |
| Loans and receivables to banks |
22 |
2,966,711 |
|
|
|
2,966,711 |
| Deposits with financial institutions |
23 |
3,003,275 |
|
|
|
3,003,275 |
| Loans and receivables to customers |
24 |
63,385,093 |
7,545,029 |
4,128,209 |
|
75,058,331 |
| Other investment securities |
25 |
2,669,959 |
|
|
|
2,669,959 |
| Other non-financial assets |
|
– |
|
|
8,183,499 |
8,183,499 |
|
Total assets
|
|
74,474,232 |
7,545,029 |
4,128,209 |
8,183,499 |
94,330,969 |
| As at 31 March 2020 |
|
|
|
|
|
|
| Cash and cash equivalents |
20 |
1,391,919 |
|
|
|
1,391,919 |
| Financial assets measured at FVTPL |
21 |
56,442 |
|
|
|
56,442 |
| Loans and receivables to banks |
22 |
3,691,374 |
|
|
|
3,691,374 |
| Deposits with financial institutions |
23 |
4,387,464 |
|
|
|
4,387,464 |
| Loans and receivables to customers |
24 |
62,197,923 |
6,093,805 |
4,131,099 |
|
72,422,827 |
| Other investment securities |
25 |
2,362,194 |
|
|
|
2,362,194 |
| Other non-financial assets |
|
|
|
|
8,882,929 |
|
|
Total assets
|
|
74,087,316 |
6,093,805 |
4,131,099 |
8,882,929 |
93,195,149 |
Amounts arising from Expected Credit Losses (ECL)
This note highlights inputs, assumptions, and techniques used for estimating expected credit losses (ECL) as per SLFRS 9 – “Financial Instruments”.
Significant increase in credit risk
When determining whether the risk of default on a financial instrument has increased significantly since initial recognition, the Company considers reasonable and supportable information that is relevant and available without undue cost or effort. This includes both quantitative and qualitative information and analysis, based on the Company historical experience and expert credit assessment and including forward-looking information.
Credit risk
Assessment of credit risk is based on a variety of data by applying experienced credit judgement. Credit risk is evaluated using qualitative and quantitative factors that are indicative of risk of default. These factors vary depending on the nature of the exposure and the type of borrower.
Each exposure is assessed at initial recognition based on available information about the borrower. Exposures are subject to ongoing monitoring, which may result in an exposure being moved to a different credit risk grade based on 3-stage model. The monitoring typically involves use of the following data:
| Corporate exposures |
Retail exposures |
All exposures |
| Information obtained during periodic review of customer files – e.g. Audited financial statements, management accounts, budgets and projections. |
Internally collected data on customer behaviour |
Payment record – this includes overdue status as well as a range of variables about payment ratios |
| Data from credit reference agencies, press articles, changes in external credit ratings |
Affordability metrics |
Requests for and granting of for bearance |
| Actual and expected significant changes in the political, regulatory and technological environment of the borrower or in its business activities |
External data from credit reference agencies including industry-standard credit scores |
Existing and forecast changes in business, financial and economic conditions |
Due to the implications of moratorium/ debt concessionary schemes on PDs and LDGs (due to limited movements to Stage 2 and 3), adjustments have been made as overlays based on stress testing and historic patters to better reflect the adequacy of ECL.
Generating the term structure of probability of default (PD)
Days past due has taken as the primary input into the determination of the term structure of PD for exposures. The Company collects performance and default information about its credit risk exposures analysed by the type of product and the borrower. For some portfolios, information gathered from external credit agencies is also used. (Debt Investments)
The Company employs statistical models to analyse the data collected and generate estimates of the remaining lifetime PD of exposures and how these are expected to change as a result of the passage of time.
This analysis includes the identification and calibration of relationships between changes in default rates and changes in key macroeconomic factors as well as in-depth analysis of the impact of certain other factors (e.g. forbearance experience) on the risk of default.
Using variety of external actual and forecasted information, the Company formulates a “base case” view of the future direction of relevant economic variables (GDP growth, inflation, interest rates and unemployment, with lag effect of these variables) as well as a representative range (Best Case and Worst Case) of other possible forecast scenarios. The Company then uses these forecasts to adjust its estimates of PDs.
Determining whether credit risk has increased significantly
The assessment of whether credit risk on a financial asset has increased significantly will be one of the critical judgements used in expected credit loss model prescribed in SLFRS 9 – “Financial Instruments”. The criteria for determining whether credit risk has increased significantly vary by portfolio and include qualitative factors, including a backstop based on delinquency.
Using its expert credit judgement and, where possible, relevant historical experience, the Company may determine that an exposure has undergone a significant increase in credit risk based on particular qualitative indicators that it considers are indicative of such and whose effect may not otherwise be fully-reflected in its quantitative analysis on a timely basis.
As a backstop, the Company considers that a significant increase in credit risk occurs no later than when an asset is more than 60 days past due. Days past due are determined by counting the number of days since the earliest elapsed due date in respect of which full payment has not been received. Due dates are determined without considering any grace period that might be available to the borrower.
The Company monitors the effectiveness of the criteria used to identify significant increases in credit risk by regular reviews.
Modified financial assets
The contractual terms of a loan may be modified for a number of reasons, including changing market conditions, customer retention and other factors not related to a current or potential credit deterioration of the customer. An existing loan whose terms have been modified may be derecognised and the renegotiated loan recognised as a new loan at fair value.
When the terms of a financial asset are modified and the modification does not result in derecognition, the determination of whether the asset’s credit risk has increased significantly by analysing both qualitative and based on the delinquency status before the modification of terms of the contract.
The Company renegotiates loans to customers in financial difficulties (referred to as “forbearance activities”) to maximise collection opportunities and minimise the risk of default. Under the Company’s forbearance policy, loan forbearance is granted on a selective basis if the debtor is currently in default on its debt or if there is a high risk of default, there is evidence that the debtor made all reasonable efforts to pay under the original contractual terms and the debtor is expected to be able to meet the revised terms.
The revised terms usually include extending the maturity, changing the timing of interest payments and amending the terms of loan covenants. Both retail and corporate loans are subject to the forbearance policy. The Company Audit Committee regularly reviews reports on forbearance activities.
For financial assets modified as part of the Company’s forbearance policy, the estimate of PD reflects whether the modification has improved or restored the Company’s ability to collect interest and principal and the Company’s previous experience of similar forbearance action. As part of this process, the Company evaluates the borrower’s payment performance against the modified contractual terms and considers various behavioural indicators.
Generally, forbearance is a qualitative indicator of a significant increase in credit risk and an expectation of forbearance may constitute evidence that an exposure is credit-impaired/in default. A customer needs to demonstrate consistently good payment behaviour over a period of time before the exposure is no longer considered to be credit-impaired/in default.
Definition of default
The Company considers a financial asset to be in default when:
- the borrower is unlikely to pay its credit obligations to the Company in full, without recourse by the Company to actions such as realising security (if any is held); or
- the borrower is past due more than 150 days on any material credit obligation to the Company. In determination of default the Company largely aligns with the regulatory definition of default.
- In assessing whether a borrower is in default, the Company considers indicators that are:
– qualitative – e.g., breaches of covenant;
– quantitative – e.g., overdue status and non-payment on another obligation of the same issuer to the Company; and
– based on data developed internally and obtained from external sources.
Inputs into the assessment of whether a financial instrument is in default and their significance may vary over time to reflect changes in circumstances.
Incorporation of forward-looking information
The Company incorporates forward-looking information into both its assessment of whether the credit risk of an instrument has increased significantly since its initial recognition and its measurement of ECL. Using variety of external actual and forecasted information, the Company formulates a “base case” view of the future direction of relevant economic variables as well as a representative range (Best Case and Worst Case) of other possible forecast scenarios.
This process involves developing two or more additional economic scenarios and considering the relative probabilities of each outcome. External information includes economic data and forecasts published by both local and international sources.
The base case represents a most-likely outcome and is aligned with information used by the Company for other purposes such as strategic planning and budgeting. The other scenarios represent more optimistic and more pessimistic outcomes. Periodically, the Company carries out stress testing of more extreme shocks to calibrate its determination of these other representative scenarios.
The Company has identified and documented key drivers of credit risk and credit losses for each portfolio of financial instruments and, using an analysis of historical data, has estimated relationships between macroeconomic variables and credit risk and credit losses. The Economic variables used by the Company based on the statistical significance include the followings:
| Unemployment rate |
Base case scenario along with two other scenarios has been used (Best Case and Worst Case) |
| Interest rate |
| GDP Growth rate |
| Inflation rate |
As at 31 March 2021, the base case assumptions have been updated to reflect the rapidly evolving situation with respect to COVID-19 by using the economic forecast. The key consideration for probability weightings in the current period is the continuing impact of COVID-19.In addition to the base case forecast which reflects the negative economic consequences of COVID-19, greater weighting has been applied to the worst scenario given the Company’s assessment of downside risks. The assigned probability weightings are subject to a high degree of inherent uncertainty and therefore the actual outcomes may be significantly different to those projected.
Measurement of ECL. Management overlays (including COVID-19 overlays) which add to the modelled ECL provision have been made for risks particular for risk elevated sectors identified by the Company.
The key inputs into the measurement of ECL are the term structure of the following variables:
- Probability of default (PD)
- Loss given default (LGD)
- Exposure at default (EAD)
These parameters are generally derived from internally developed statistical models and other historical data. They are adjusted to reflect forward-looking information as described above.
Probability of Default (PD)
PD estimates are estimates at a certain date, which are calculated based on statistical models, and assessed using various categories based on homogenous characteristics of exposures. These statistical models are based on internally compiled data comprising both quantitative and qualitative factors. Where it is available, market data may also be used to derive the PD for large corporate counterparties.
Loss Given Default (LGD)
LGD is the magnitude of the likely loss if there is a default. The Company estimates LGD parameters based on the history of recovery rates of claims against defaulted counterparties. The LGD models consider the structure, collateral, seniority of the claim, product category and recovery costs of any collateral that is integral tthe financial asset. They are calculated on a discounted cash flow basis using the effective interest rate as the discounting factor.
Exposure at Default (EAD)
EAD represents the expected exposure in the event of a default. The Company derives the EAD from the current exposure to the counterparty and potential changes to the current amount allowed under the contract including amortisation. The EAD of a financial asset is its gross carrying amount. For lending commitments and financial guarantees, the EAD includes the amount drawn, as well as potential future amounts that may be drawn under the contract. For some financial assets, EAD is determined by considering contractual cash flows, prepayments and other factors.
As described above, and subject to using a maximum of a 12 months PD for financial assets for which credit risk has not significantly increased, the Company measures ECL considering the risk of default over the maximum contractual period over which it is exposed to credit risk, even if, for risk management purposes, the Company considers a longer period. The maximum contractual period extends to the date at which the Company has the right to require repayment of an advance or terminate a loan commitment or guarantee.
Where modelling of a parameter is carried out on a collective basis, the financial instruments are grouped on the basis of shared risk characteristics. The groupings are subject to regular review to ensure that exposures within a particular company remain appropriately homogeneous.
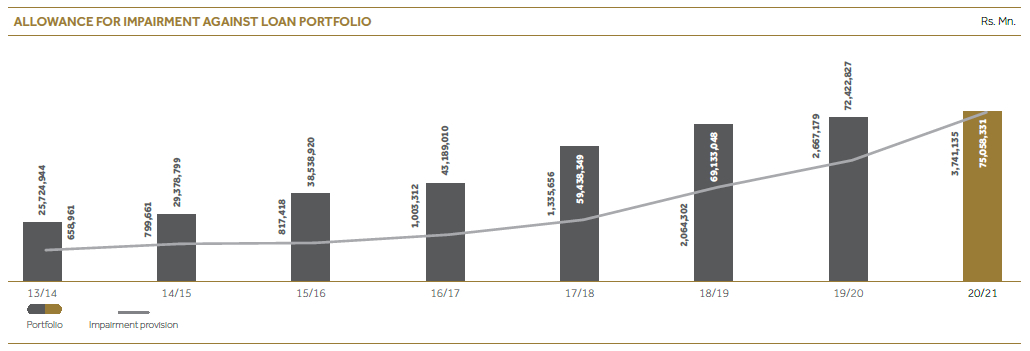
Loss allowance
The following tables show reconciliations from the opening to the closing balance of the loss allowance by class of financial instruments.
Movements in allowance for expected credit losses (Stage transition)
|
2021 |
|
Stage 1:
12 months ECL
Rs. ’000 |
Stage 2:
Lifetime ECL
not credit impaired
Rs. ’000 |
Stage 3:
Lifetime ECL
credit impaired
Rs. ’000 |
Total ECL
Rs. ’000 |
| Balance as at the beginning of the year |
557,606 |
457,235 |
1,652,338 |
2,667,179 |
| Changes due to loans and receivables recognised in opening balance that have: |
|
|
|
|
| Transferred from 12 months ECL |
(160,232) |
87,116 |
18,893 |
– |
| Transferred from lifetime ECL not credit impaired |
102,833 |
(216,467) |
21,868 |
– |
| Transferred from lifetime ECL credit impaired |
57,399 |
129,351 |
(40,761) |
– |
| Net measurement of loss allowance |
(163,422) |
103,246 |
1,134,132 |
1,073,956 |
|
Balance as at the end of the year
|
394,184 |
560,481 |
2,786,470 |
3,741,135 |
|
2020 |
|
Stage 1:
12 months ECL
Rs. ’000 |
Stage 2:
Lifetime ECL
not credit impaired
Rs. ’000 |
Stage 3:
Lifetime ECL
credit impaired
Rs. ’000 |
Total ECL
Rs. ’000 |
| Balance as at the beginning of the year |
593,675 |
444,670 |
1,156,900 |
2,195,245 |
| Changes due to loans and receivables recognised in opening balance that have: |
|
|
|
|
| Transferred from 12 months ECL |
(83,417) |
63,358 |
20,059 |
– |
| Transferred from lifetime ECL not credit impaired |
78,266 |
(155,910) |
77,644 |
– |
| Transferred from lifetime ECL credit impaired |
18,618 |
9,888 |
(28,506) |
– |
| Net measurement of loss allowance |
(49,536) |
95,229 |
426,241 |
471,934 |
|
Balance as at the end of the year
|
557,606 |
457,235 |
1,652,338 |
2,667,179 |
Loans and receivables to customers – Credit grade based on delinquency
The following table shows the loans and receivables to customers based on delinquency and expected credit losses for each stage of loss allowances:
| As at 31 March 2021 |
12 months ECL
Rs. ’000 |
Lifetime ECL –
Not credit impaired
Rs. ’000 |
Lifetime ECL –
Credit impaired
Rs. ’000 |
Total
Rs. ’000 |
| Grade 1 – Low risk |
35,384,588 |
|
|
35,384,588 |
| Grade 2 – Low risk |
11,316,907 |
|
|
11,316,907 |
| Grade 3 – Low risk |
10,998,609 |
|
|
10,998,609 |
| Grade 4 – Low risk |
6,079,173 |
|
|
6,079,173 |
| Grade 5 – Watch list |
|
4,054,254 |
|
4,054,254 |
| Grade 6 – Watch list |
|
2,204,201 |
|
2,204,201 |
| Grade 7 – Watch list |
|
1,847,055 |
|
1,847,055 |
| Grade 8 – Default |
|
|
6,914,679 |
6,914,679 |
| Gross loans and receivables to customers |
63,779,277 |
8,105,510 |
6,914,679 |
78,799,466 |
| Expected credit loss allowance |
(394,184) |
(560,481) |
(2,786,470) |
(3,741,135) |
|
Net loans and receivables to customers
|
63,385,093 |
7,545,029 |
4,128,209 |
75,058,331 |
| As at 31 March 2020 |
12 months ECL
Rs. ’000 |
Lifetime ECL –
Not credit impaired
Rs. ’000 |
Lifetime ECL –
Credit impaired
Rs. ’000 |
Total
Rs. ’000 |
| Grade 1 – Low risk |
32,361,063 |
|
|
32,361,063 |
| Grade 2 – Low risk |
10,191,631 |
|
|
10,191,631 |
| Grade 3 – Low risk |
12,731,061 |
|
|
12,731,061 |
| Grade 4 – Low risk |
7,471,774 |
|
|
7,471,774 |
| Grade 5 – Watch list |
|
3,295,735 |
|
3,295,735 |
| Grade 6 – Watch list |
|
1,826,467 |
|
1,826,467 |
| Grade 7 – Watch list |
|
1,428,838 |
|
1,428,838 |
| Grade 8 – Default |
|
|
5,783,437 |
5,783,437 |
| Gross loans and receivables to customers |
62,755,529 |
6,551,040 |
5,783,437 |
75,090,006 |
| Expected credit loss allowance |
(557,606) |
(457,235) |
(1,652,338) |
(2,667,179) |
|
Net loans and receivables to customers
|
62,197,923 |
6,093,805 |
4,131,099 |
72,422,827 |
Stage transition on loans and receivables to customers
The following table shows the net loans and receivables to customers based on 3-stage approach:
| As at 31 March 2021 |
12 months ECL
Rs. ’000 |
Lifetime ECL –
Not credit impaired
Rs. ’000 |
Lifetime ECL –
Credit impaired
Rs. ’000 |
Total
Rs. ’000 |
| Loans and receivables to customer |
|
|
|
|
| Balance as at 1 April 2020 |
62,197,923 |
6,093,805 |
4,131,099 |
72,422,827 |
| Changes due to loans and receivables recognised in opening balance that have – |
|
|
|
|
| Transferred from 12 months ECL |
(10,749,182) |
7,032,373 |
3,716,809 |
– |
| Transferred from lifetime ECL not credit impaired |
1,150,825 |
(2,766,090) |
1,615,265 |
– |
| Transferred from lifetime ECL credit impaired |
92,107 |
105,637 |
(197,744) |
– |
| Financial assets that have been derecognised |
(12,425,520) |
(1,449,116) |
(896,304) |
(14,770,940) |
| Net change in expected credit loss allowance |
163,422 |
(103,246) |
(1,134,132) |
(1,073,956) |
| Other net changes in portfolio |
22,955,518 |
(1,368,334) |
(3,106,784) |
22,955,518 |
|
Balance as at 31 March 2021
|
63,385,093 |
7,545,029 |
4,128,209 |
75,058,331 |
| As at 31 March 2020 |
12 months ECL
Rs. ’000 |
Lifetime ECL –
Not credit impaired
Rs. ’000 |
Lifetime ECL –
Credit impaired
Rs. ’000 |
Total
Rs. ’000 |
| Loans and receivables to customer |
|
|
|
|
| Balance as at 1 April 2019 |
62,475,540 |
5,316,728 |
3,789,813 |
71,582,081 |
| Changes due to loans and receivables recognised in opening balance that have – |
|
|
|
|
| Transferred from 12 months ECL |
(4,840,353) |
3,758,637 |
1,081,716 |
– |
| Transferred from lifetime ECL not credit impaired |
1,082,954 |
(1,992,423) |
909,469 |
– |
| Transferred from lifetime ECL credit impaired |
91,370 |
48,313 |
(139,683) |
– |
| Financial assets that have been derecognised |
(11,754,086) |
(2,420,287) |
(1,016,573) |
(15,190,946) |
| Net change in expected credit loss allowance |
49,536 |
(95,229) |
(426,241) |
(471,934) |
| Other net changes in portfolio |
15,092,962 |
1,478,066 |
(67,402) |
16,503,626 |
|
Balance as at 31 March 2020
|
62,197,923 |
6,093,805 |
4,131,099 |
72,422,827 |
Maximum exposure to credit risk – based on aging
Table below shows the maximum exposure to credit risk based on the aging of each instrument:
|
Loans and receivables
to customers |
Loans and receivables
to banks |
Deposits with
financial institutions |
Other investment securities and financial assets measured at FVTPL |
| As at 31 March |
2021
Rs. ’000 |
2020
Rs. ’000 |
2021
Rs. ’000 |
2020
Rs. ’000 |
2021
Rs. ’000 |
2020
Rs. ’000 |
2021
Rs. ’000 |
2020
Rs. ’000 |
| Financial assets measured at
amortised cost |
|
|
|
|
|
|
|
|
| 0-30 days |
46,701,495 |
42,552,694 |
2,966,711 |
3,691,374 |
3,003,536 |
4,387,725 |
2,669,960 |
2,362,195 |
| 31-60 days |
10,998,609 |
12,731,061 |
|
|
|
|
|
|
| 61-90 days |
6,079,173 |
7,471,774 |
|
|
|
|
|
|
| 91-120 days |
4,054,254 |
3,295,735 |
|
|
|
|
|
|
| 121-150 days |
2,204,201 |
1,826,467 |
|
|
|
|
|
|
| Above 150 days |
1,847,055 |
1,428,838 |
|
|
|
|
|
|
| Above 180 Days |
6,914,679 |
5,783,437 |
|
|
|
|
|
|
|
Total gross amount
|
78,799,466 |
75,090,006 |
2,966,711 |
3,691,374 |
3,003,536 |
4,387,725 |
2,669,960 |
2,362,195 |
| Allowance for impairment |
(3,741,135) |
(2,667,179) |
– |
– |
(261) |
(261) |
(1) |
(1) |
|
Net carrying amount
|
75,058,331 |
72,422,827 |
2,966,711 |
3,691,374 |
3,003,274 |
4,387,464 |
2,669,959 |
2,362,194 |
| Financial assets measured at FTVPL |
|
|
|
|
|
|
|
|
| 0 days |
|
|
|
|
|
|
160,639 |
56,442 |
|
Total gross amount
|
|
|
|
|
|
|
160,639 |
1,687,004 |
| Allowance for impairment |
– |
– |
– |
– |
– |
– |
– |
– |
| Net carrying amount |
|
|
|
|
|
|
160,639 |
1,687,004 |
|
Maximum exposure
|
75,058,331 |
72,422,827 |
2,966,711 |
3,691,374 |
3,003,275 |
4,387,464 |
2,830,598 |
4,049,198 |
Age represents the period in days which any amount uncollected or due beyond their contractual due date. For rescheduled loans age is calculate based on the initial due date of the original contract.
A.II Impaired financial instruments
Impaired loans and receivables and other financial instruments
The Company regards a loan and receivable or a other financial instrument impaired when there is an objective evidence demonstrates that a loss event has occurred after the initial recognition of the asset(s), and that the loss event has an impact on the future cash flows of the asset(s). As per SLFRS 9 – “Financial Instruments” stage three assets are considered as credit impaired.
A loan that has been renegotiated due to a deterioration in the borrower’s condition is usually considered to be impaired unless there is evidence that the risk of not receiving contractual cash flows has reduced significantly and there are no other indicators of impairment.
| As at 31 March |
2021
Rs. ’000 |
2020
Rs. ’000 |
| Impaired financial instruments |
|
|
| Loans and receivables to customers |
4,128,209 |
4,131,099 |
|
Total credit impaired value
|
4,128,209 |
4,131,099 |
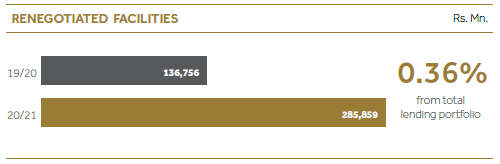
Loans and receivables with renegotiated terms and the Company’s forbearance policy
The contractual terms of a loan may be modified for a number of reasons, including changing market conditions, customer retention and other factors not related to a current or potential credit deterioration of the customer. An existing loan whose terms have modified may be derecognised and the renegotiated loan recognised as a new loan at fair value.
The Company renegotiates loans to customers in financial difficulties (referred to as ‘forbearance activities’) to maximise collection opportunities and minimise the risk of default, there is evidence that the debtor is currently in default on its debt or if there is a high risk of default, there is evidence that the debtor made all reasonable efforts to pay under the original contractual terms and the debtor is expected to be able to meet the revised terms.
The revised terms usually include extending the maturity, changing the timing of interest payments and amending the terms of loan covenants.
The table below set out information about the loans and receivables with renegotiated terms:
| As at 31 March |
2021
Rs. ’000 |
2020
Rs. ’000 |
| Gross carrying amount |
285,859 |
136,756 |
| Total gross loans and receivables |
78,799,466 |
75,090,006 |
| Percentage of renegotiated loans (%) |
0.36 |
0.18 |
Write-off policy
The Company writes-off a loan or an investment debt/equity security balance and any related allowances for impairment losses, when it determines that the loans security is uncollectible. This determination is made after considering information such as the occurrence of significant changes in the borrower’s/issuer’s financial position such that the borrower/issuer can no longer pay the obligation or that proceeds from collateral will not be sufficient to pay back the entire exposure. For smaller balance standardised loans, write-off decisions generally are based on a product-specific past due status. The Company’s policy is to pursue timely realisation of the collateral in an orderly manner.
A.III Collateral held and other credit enhancements
The Company holds collateral and other credit enhancements against certain of its credit exposures. The table below sets out the principal types of collateral held against types of loans and receivables.
Collateral held
|
|
Percentage of exposure that is
subject to collateral requirements |
Type of collateral Held |
|
Note |
2021
% |
2020
% |
|
| Loans and receivables to banks |
|
|
|
|
| Securities purchased under resale agreements |
22 |
100 |
100 |
Marketable Securities |
| Loans and receivable to customers |
|
|
|
|
| Lease and hiring contracts |
24 |
100 |
100 |
Vehicles |
| Mortgage loan |
24 |
100 |
100 |
Property and equipment |
| Personal loans and staff loans |
24 |
– |
– |
Vehicles and guarantors |
| Loans against deposits |
24 |
100 |
100 |
Lien deposits |
| Gold loans |
24 |
100 |
100 |
Pawning articles |
| Margin trading |
24 |
100 |
100 |
Equity securities |
A.IV Concentration of credit risk
Company reviews on regular basis its concentration of credit granted in each of the products offered. The diversification was made to ensure that an acceptable level of risk in line with the risk appetite of the Company is maintained. The diversification decisions are made at the ALCO, where it sets targets and present strategies to the Management in optimising the diversification. The product development team of the Company is advised on the strategic decisions taken to diversify the portfolio to align their product development activities accordingly.
The Company monitors concentration of credit risk by product, by sector and by geographical location. An analysis of concentrations of credit risk of loan and receivable to customers and other financial investments is shown below:
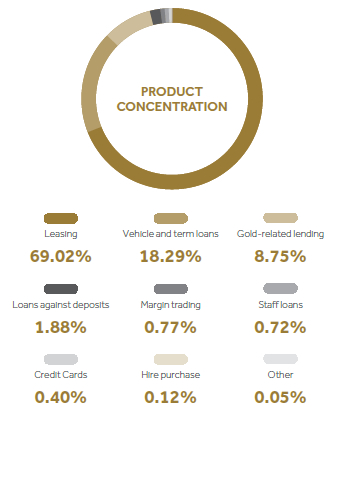
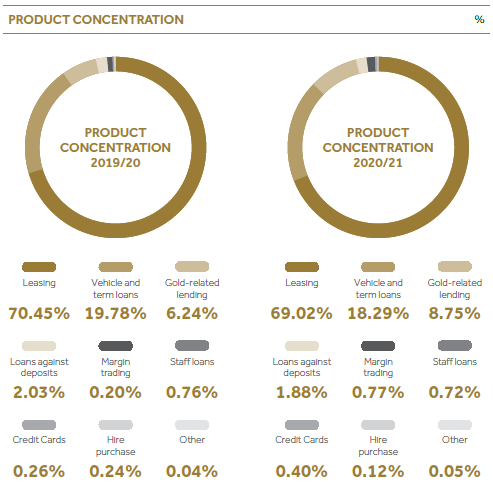
Product concentration
The Company monitors concentration of credit risk by product categories and analysis is shown below:
| As at 31 March |
2021
Rs. ’000 |
% |
2020
Rs. ’000 |
% |
| Leasing |
54,387,452 |
69.0 |
52,898,212 |
70.4 |
| Vehicle and term loans |
14,415,477 |
18.3 |
14,854,004 |
19.8 |
| Gold-related lending |
6,893,299 |
8.7 |
4,687,708 |
6.2 |
| Loans against deposits |
1,482,835 |
1.9 |
1,524,697 |
2.0 |
| Margin trading |
608,609 |
0.8 |
153,767 |
0.2 |
| Staff loans |
569,461 |
0.7 |
567,573 |
0.8 |
| Credit cards |
313,329 |
0.4 |
196,342 |
0.3 |
| Hire purchase |
91,855 |
0.1 |
180,944 |
0.2 |
| Other |
37,149 |
0.0 |
26,759 |
0.0 |
|
Gross loans and receivables to customers
|
78,799,466 |
|
75,090,006 |
|
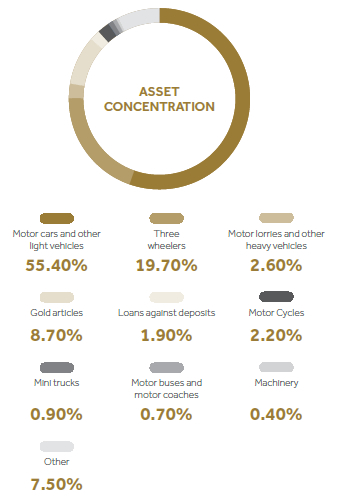
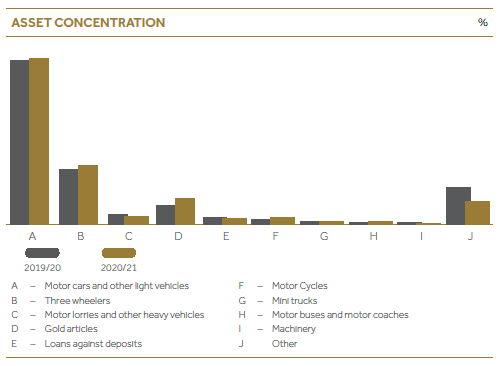
Asset concentration
The Company monitors concentration of credit risk by asset categories and an analysis is shown below:
| As at 31 March |
2021
Rs. ’000 |
% |
2020
Rs. ’000 |
% |
| Motor cars and other light vehicles |
43,635,257 |
55.4 |
41,149,370 |
54.8 |
| Three wheelers |
15,513,782 |
19.7 |
13,780,660 |
18.4 |
| Motor lorries and other heavy vehicles |
2,066,940 |
2.6 |
2,372,641 |
3.2 |
| Gold articles |
6,893,299 |
8.7 |
4,687,708 |
6.2 |
| Loans against deposits |
1,482,835 |
1.9 |
1,524,697 |
2.0 |
| Motor cycle |
1,751,245 |
2.2 |
931,087 |
1.2 |
| Mini trucks |
681,294 |
0.9 |
698,468 |
0.9 |
| Motor buses and motor coach |
527,387 |
0.7 |
506,749 |
0.7 |
| Machineries |
333,112 |
0.4 |
333,215 |
0.4 |
| Other |
5,914,315 |
7.5 |
9,105,412 |
12.1 |
|
Gross loans and receivables to customers
|
78,799,466 |
|
75,090,006 |
|
Geographical concentration
Company reviews its geographical diversification on regular basis at the ALCO and sets long-term target in achieving a geographically well-diversified credit portfolio. Company’s strategy on geographical diversification was executed through the establishment of a distribution network for the Company. The geographical concentration is considered when selecting prospective locations for new branches as well. The credit concentration of the economy is mostly affected by the wealth distribution of the country where high concentration was seen in the Western Province.
| As at 31 March |
2021
Rs. ’000 |
% |
2020
Rs. ’000 |
% |
| Western |
36,645,005 |
46.5 |
36,279,118 |
48.3 |
| North Western |
10,990,642 |
13.9 |
10,522,697 |
14.0 |
| Central |
9,332,493 |
11.8 |
8,541,664 |
11.4 |
| Sabaragamuwa |
7,373,340 |
9.4 |
6,632,282 |
8.8 |
| Southern |
5,632,252 |
7.1 |
5,166,111 |
6.9 |
| North Central |
3,175,664 |
4.0 |
2,803,863 |
3.7 |
| Uva |
3,165,408 |
4.0 |
2,782,727 |
3.7 |
| Eastern |
1,702,590 |
2.2 |
1,513,454 |
2.0 |
| North |
782,072 |
1.0 |
848,090 |
1.1 |
|
Gross loans and receivables to customers
|
78,799,466 |
|
75,090,006 |
|
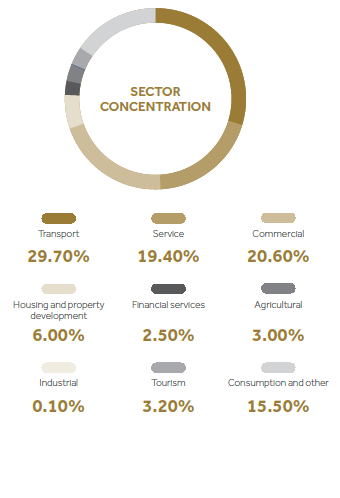
Sector-wise analysis of credit exposures
Company manages its credit exposure to a single industry by regularly reviewing the portfolio. As there is more concentration on the vehicle-related financing of the Company there is an inherent concentration on the transportation sector.
Company has set targets to bring down the exposures to each industry to a level accepted by the Company based on its risk appetite.
| As at 31 March |
2021
Rs. ’000 |
% |
2020
Rs. ’000 |
% |
| Transport |
23,369,112 |
29.7 |
29,329,991 |
39.1 |
| Service |
15,295,888 |
19.4 |
12,847,689 |
17.1 |
| Commercial |
16,210,104 |
20.6 |
12,246,877 |
16.3 |
| Housing and property development |
4,702,654 |
6.0 |
3,857,191 |
5.1 |
| Financial services |
2,005,287 |
2.5 |
1,598,535 |
2.1 |
| Agricultural |
2,385,341 |
3.0 |
1,611,624 |
2.1 |
| Industrial |
66,893 |
0.1 |
74,253 |
0.1 |
| Tourism |
2,525,585 |
3.2 |
2,382,696 |
3.2 |
| Consumption and other |
12,238,602 |
15.5 |
11,141,150 |
14.8 |
|
Gross loans and receivables to customers
|
78,799,466 |
|
75,090,006 |
|
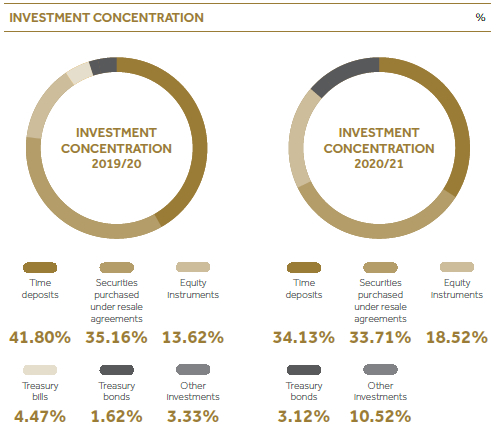
Concentration of other financial investments
Company manages its credit exposure to a single investment security by regularly reviewing the investment portfolio. This analysis includes all the financial investments classified under financial assets measured at FVTPL, loans and receivables to banks, deposits with financial institutions and other investment securities.
| As at 31 March |
2021
Rs. ’000 |
% |
2020
Rs. ’000 |
% |
| Time deposits |
3,003,275 |
34.1 |
4,387,464 |
41.8 |
| Securities purchased under resale agreements |
2,966,711 |
33.7 |
3,691,374 |
35.2 |
| Equity instruments |
1,631,090 |
18.5 |
1,429,627 |
13.6 |
| Treasury bills |
– |
0.0 |
469,607 |
4.5 |
| Treasury bonds |
274,299 |
3.1 |
170,035 |
1.6 |
| Other investments |
926,209 |
10.5 |
349,367 |
3.3 |
|
Total other financial investments
|
8,800,584 |
|
10,497,474 |
|
A.V Offsetting financial assets and liabilities
The disclosure set out in the table below include financial assets and liabilities that are offset in the Company’s Statement of Financial Position or that are subject to an enforceable master netting arrangement or similar financial agreements. Similar financial agreements include sale and repurchase agreements, reverse sale and repurchase agreements and securities borrowing and lending agreements.
Master netting arrangements do not meet the criteria for offsetting in the Statement of Financial Position until event of default is occurred. Table below shows financial assets subject to offsetting, enforceable master netting agreements and similar agreements:
| As at 31 March 2021 |
Gross amount
recognised
in financial
assets
Rs. ’000 |
Gross amount recognised in
financial liabilities |
Net
exposure
Rs. ’000 |
Underlying
security |
Offset in
Statement of
Financial
Position
Rs. ’000 |
Not offset in
Statement of
Financial
Position
Rs. ’000 |
Types of
financial assets |
|
|
|
|
|
| Securities purchased under resale agreements |
2,966,711 |
|
2,966,711 |
|
Treasury bills |
| Loans and receivables to customers |
1,482,835 |
|
1,482,835 |
|
Term
deposits |
| As at 31 March 2020 |
Gross amount
recognised
in financial
assets
Rs. ’000 |
Gross amount recognised in
financial liabilities |
Net
exposure
Rs. ’000 |
Underlying
security |
Offset in
Statement of
Financial
Position
Rs. ’000 |
Not offset in
Statement of
Financial
Position
Rs. ’000 |
| Types of financial assets |
|
|
|
|
|
| Securities purchased under resale agreements |
3,691,374 |
|
3,691,374 |
|
Treasury bills |
| Loans and receivables to customers |
1,524,697 |
|
1,524,697 |
|
Term
deposits |
B. Liquidity risk
B.I Exposure to liquidity risk
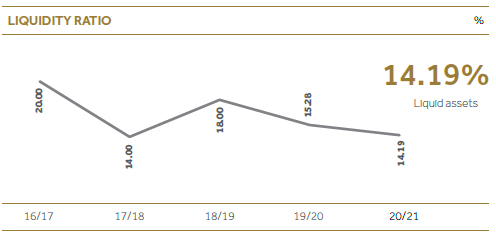
The key ratio used by the Company for managing liquidity risk is the ratio of net liquid assets to deposits from customers. For this purpose, “net liquid assets” includes cash and cash equivalents and investment-grade debt securities for which there is a active and liquid market. Details of the reported Company ratio of net liquid assets to deposits from customers at the reporting date and during the reporting period were as follows:
|
2021
% |
2020
% |
| As at 31 March |
14.19 |
15.28 |
| Average for the period |
14.96 |
15.39 |
| Maximum for the period |
18.49 |
16.31 |
| Minimum for the period |
12.66 |
14.60 |
Minimum liquidity requirement
As per the Direction 4 of 2013 of Central Bank of Sri Lanka, every finance company shall maintain minimum holding of liquid assets. The table below sets out the components of the Company’s holding of liquid assets:
| As at 31 March |
2021
Rs. ’000 |
2020
Rs. ’000 |
| Required minimum amount of liquid assets |
3,201,119 |
3,362,939 |
| Total liquid assets |
7,361,866 |
8,674,662 |
| Excess liquidity |
4,160,747 |
5,311,723 |
B.II Maturity analysis for financial liabilities and financial assets
Detailed maturity analysis is given in Note 49.
The amounts shown in the maturity analysis above have been compiled by applying discounted cash flows which exclude future interest which is applicable. Some estimated maturities will be vary due to changes in contractual cashflows such as early repayment option of loans and receivables. As a part of the management of liquidity risk arising from financial liabilities, the Company holds liquid assets comprising cash and cash equivalents and debt securities which can be readily sold to meet liquidity requirements.
The table below sets out the carrying amounts of Company’s non-derivative financial assets and financial liabilities expected to be recovered or settled more than 12 months after the reporting date:
|
|
More than 12 months |
| As at 31 March |
Note |
2021
Rs. ’000 |
2020
Rs. ’000 |
| Financial assets |
|
|
|
| Loans and receivables to customers |
24 |
40,871,943 |
43,659,808 |
| Other investment securities |
25 |
1,684,405 |
1,498,300 |
|
Total financial assets
|
|
42,556,348 |
45,158,108 |
| Financial liabilities |
|
|
|
| Deposits from customers |
33 |
11,334,464 |
7,996,309 |
| Debt securities issued |
34 |
4,072,475 |
5,092,096 |
| Other interest-bearing liabilities |
35 |
13,279,221 |
15,477,748 |
|
Total financial liabilities
|
|
28,686,160 |
28,566,153 |
B.III Liquidity reserves
The table below sets out the components of the Company’s liquidity reserves:
| As at 31 March |
2021
Rs. ’000 |
% |
2020
Rs. ’000 |
% |
| Cash and balances with other banks |
1,833,978 |
2.3 |
1,096,141 |
12.6 |
| Other cash and cash equivalents |
2,295,664 |
2.9 |
3,437,561 |
39.6 |
| Investments in Government securities |
3,232,224 |
4.1 |
4,140,960 |
47.7 |
|
Total liquidity reserves
|
7,361,866 |
|
8,674,662 |
|
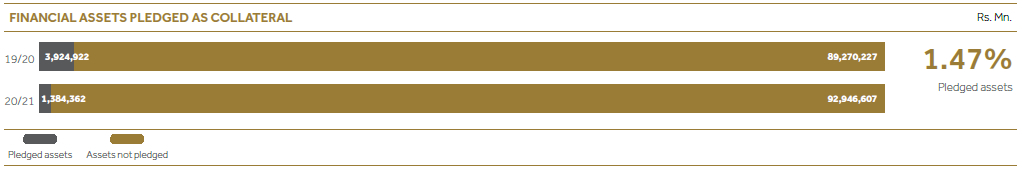
B.IV Financial assets available for future funding
The table below sets out the availability of the Company’s financial assets to support future funding.
|
|
Encumbered |
Unencumbered |
|
| As at 31 March 2021 |
Note |
Pledge as a
collateral
Rs. ’000 |
Other*
Rs. ’000 |
Available as
collateral
Rs. ’000 |
Other**
Rs. ’000 |
Total
Rs. ’000 |
| Cash and cash equivalents |
20 |
|
|
|
2,090,509 |
2,090,509 |
| Financial assets measured at FVTPL |
21 |
|
|
|
160,639 |
160,639 |
| Derivative financial assets |
|
|
|
|
198,046 |
198,046 |
| Loans and receivables to banks |
22 |
|
|
|
2,966,711 |
2,966,711 |
| Deposits with financial institutions |
23 |
707,611 |
|
2,295,664 |
|
3,003,275 |
| Loans and receivables to customers |
24 |
676,751 |
|
66,605,498 |
7,776,090 |
75,058,331 |
| Other investment securities |
25 |
|
|
|
2,669,959 |
2,669,959 |
| Non-financial assets |
|
|
|
8,183,499 |
|
8,183,499 |
|
Total assets
|
|
1,384,362 |
|
77,084,661 |
15,861,946 |
94,330,969 |
* Represents assets that are not pledged but that the Company believes it is restricted from using to secure funding, for legal or other reasons.
** Represents assets that are not restricted for use as collateral, but the Company would not consider them as readily available to secure funding in the normal course of business.
|
|
Encumbered |
Unencumbered |
|
| As at 31 March 2020 |
Note |
Pledge as a
collateral
Rs. ’000 |
Other*
Rs. ’000 |
Available as
collateral
Rs. ’000 |
Other**
Rs. ’000 |
Total
Rs. ’000 |
| Cash and cash equivalents |
20 |
|
|
|
1,391,919 |
1,391,919 |
| Financial assets measured at FVTPL |
21 |
|
|
|
56,442 |
56,442 |
| Loans and receivables to banks |
22 |
|
|
|
3,691,374 |
3,691,374 |
| Deposits with financial institutions |
23 |
949,903 |
|
3,437,561 |
|
4,387,464 |
| Loans and receivables to customers |
24 |
2,975,019 |
|
63,996,183 |
5,451,625 |
72,422,827 |
| Other investment securities |
25 |
|
|
|
2,362,194 |
2,362,194 |
| Non-financial assets |
|
|
|
8,882,929 |
|
8,882,929 |
|
Total assets
|
|
3,924,922 |
|
76,316,673 |
12,953,554 |
93,195,149 |
* Represents assets that are not pledged but that the Company believes it is restricted from using to secure funding, for legal or other reasons.
** Represents assets that are not restricted for use as collateral, but the Company would not consider them as readily available to secure funding in the normal course of business.
C. Market risk
c. i. Exposure to market risk
The table below sets out the allocation of Company’s assets and liabilities subject to market risk between trading and non-trading assets.
|
|
Carrying amount |
Market risk measure |
| As at 31 March 2021 |
Note |
Rs. ’000 |
Trading assets
Rs. ’000 |
Non-trading
Assets
Rs. ’000 |
| Assets subject to market risk |
|
|
|
|
| Cash and cash equivalents |
20 |
2,090,509 |
|
2,090,509 |
| Financial assets measured at FVTPL |
21 |
160,639 |
160,639 |
|
| Derivative financial assets |
|
198,046 |
198,046 |
|
| Loans and receivables to banks |
22 |
2,966,711 |
|
2,966,711 |
| Deposits with financial institutions |
23 |
3,003,275 |
|
3,003,275 |
| Loans and receivables to customers |
24 |
75,058,331 |
|
75,058,331 |
| Other investment securities |
25 |
2,669,959 |
|
2,669,959 |
|
Total assets subject to market risk
|
|
86,147,470 |
358,685 |
85,788,785 |
| Liabilities subject to market risk |
|
|
|
|
| Derivative financial liabilities |
32 |
13,142 |
13,142 |
|
| Deposits from customers |
33 |
48,999,341 |
|
48,999,341 |
| Debt securities issued |
34 |
5,089,839 |
|
5,089,839 |
| Other interest-bearing liabilities |
35 |
21,719,986 |
|
21,719,986 |
|
Total liabilities subject to market risk
|
|
75,822,308 |
13,142 |
75,809,166 |
|
|
Carrying amount |
Market risk measure |
| As at 31 March 2020 |
Note |
Rs. ’000 |
Trading assets
Rs. ’000 |
Non-trading
Assets
Rs. ’000 |
| Assets subject to market risk |
|
|
|
|
| Cash and cash equivalents |
20 |
1,391,919 |
|
1,391,919 |
| Financial assets measured at FVTPL |
21 |
56,442 |
56,442 |
|
| Loans and receivables to banks |
22 |
3,691,374 |
|
3,691,374 |
| Deposits with financial institutions |
23 |
4,387,464 |
|
4,387,464 |
| Loans and receivables to customers |
24 |
72,422,827 |
|
72,422,827 |
| Other investment securities |
25 |
2,362,194 |
|
2,362,194 |
|
Total assets subject to market risk
|
|
84,312,220 |
56,442 |
84,255,778 |
| Liabilities subject to market risk |
|
|
|
|
| Derivative financial liabilities |
32 |
60,440 |
60,440 |
|
| Deposits from customers |
33 |
43,305,775 |
|
43,305,775 |
| Debt securities issued |
34 |
5,092,096 |
|
5,092,096 |
| Other interest-bearing liabilities |
35 |
27,505,136 |
|
27,505,136 |
|
Total liabilities subject to market risk
|
|
75,963,447 |
60,440 |
75,903,007 |
C.ii. Value at Risk (VaR)
Value at risk (VaR) is a statistical technique used to quantify the level of financial risk within a company or investment portfolio over
a specific time period. It estimates how much a set of investments might lose in given normal market conditions.
VaR has been implemented in the Company to measure the market risk exposure of our trading assets on monthly basis. Company calculates VaR monthly using 95% confidential level and one month holding period. Our VaR Model is based on variance-covariance method which calculates portfolio’s maximum loss by analysing historic market prices.
A summary of VaR positions as at 31 March 2021 and 2020 is given below:
|
2021 |
| As at 31 March 2021 |
Carrying
amount
Rs. ’000 |
Portfolio value
Rs. ’000 |
Risk adjusted
Portfolio value
Rs. ’000 |
Value at risk
Rs. ’000 |
| Financial assets measured at FVTPL |
|
|
|
|
| Government securities |
160,639 |
150,000 |
163,091 |
13,091 |
|
Total financial assets measured at FVTPL
|
160,639 |
150,000 |
163,091 |
13,091 |
|
2020 |
| As at 31 March 2020 |
Carrying
amount
Rs. ’000 |
Portfolio value
Rs. ’000 |
Risk adjusted
Portfolio value
Rs. ’000 |
Value at risk
Rs. ’000 |
| Financial assets measured at FVTPL |
|
|
|
|
| Government securities |
56,442 |
50,000 |
54,364 |
4,364 |
|
Total financial assets measured at FVTPL
|
56,442 |
50,000 |
54,364 |
4,364 |
C.iii Exposure to interest rate risk
Interest rate risk exists in interest-bearing assets and liabilities, due to the possibility of a change in the asset’s value resulting from the variability of interest rates. Since interest rate risk management has become imperative, CDB takes proactive measures to manage the exposure by forecasting the rate fluctuations. We perform scenario analysis in the course of observing liquidity position, market movements and reprise products-based thereon.
The following table exhibits the gap between the interest-earning financial assets and interest-bearing financial liabilities of the Company:
|
|
|
Market risk measure |
| As at 31 March 2021 |
Note |
Carrying amount
Rs. ’000 |
Less than
12 months
Rs. ’000 |
1-2 years
Rs. ’000 |
2-5 years
Rs. ’000 |
More than
5 years
Rs. ’000 |
| Interest-bearing assets |
|
|
|
|
|
|
| Financial assets measured at FVTPL |
21 |
160,639 |
160,639 |
|
|
|
| Derivative financial assets |
32 |
198,046 |
198,046 |
|
|
|
| Loans and receivables to banks |
22 |
2,966,711 |
2,966,711 |
|
|
|
| Deposits with financial institutions |
23 |
3,003,275 |
3,003,275 |
|
|
|
| Loans and receivables to customers |
24 |
75,058,331 |
34,186,388 |
16,052,420 |
19,597,167 |
5,222,356 |
| Other investment securities |
25 |
2,669,959 |
985,554 |
54,315 |
|
1,630,090 |
|
Total interest-bearing assets
|
|
84,056,961 |
41,500,613 |
16,106,735 |
19,597,167 |
6,852,446 |
| Interest-bearing liabilities |
|
|
|
|
|
|
| Derivative financial liabilities |
32 |
13,142 |
13,142 |
|
|
|
| Deposits from customers |
33 |
48,999,341 |
37,664,876 |
6,047,317 |
5,210,774 |
76,374 |
| Debt securities issued |
34 |
5,089,839 |
1,017,363 |
|
4,072,476 |
|
| Other interest-bearing borrowings |
35 |
21,719,986 |
8,440,762 |
6,840,204 |
5,225,694 |
1,213,326 |
|
Total interest-bearing liabilities
|
|
75,822,308 |
47,136,143 |
12,887,521 |
14,508,944 |
1,289,700 |
|
Net interest-bearing assets gap
|
|
8,234,653 |
(5,635,530) |
3,219,214 |
5,088,223 |
5,562,746 |
|
|
|
|
Market risk measure |
| As at 31 March 2020 |
Note |
|
Carrying amount
Rs. ’000 |
Less than
12 months
Rs. ’000 |
1-2 years
Rs. ’000 |
2-5 years
Rs. ’000 |
More than
5 years
Rs. ’000 |
| Interest-bearing assets |
|
|
|
|
|
|
|
| Financial assets measured at FVTPL |
21 |
|
56,442 |
56,442 |
|
|
|
| Loans and receivables to banks |
22 |
|
3,691,374 |
3,691,374 |
|
|
|
| Deposits with financial institutions |
23 |
|
4,387,464 |
4,387,464 |
|
|
|
| Loans and receivables to customers |
24 |
|
72,422,827 |
29,014,063 |
16,496,437 |
24,887,173 |
2,025,154 |
| Other investment securities |
25 |
|
2,362,194 |
821,335 |
62,615 |
43,426 |
1,434,818 |
|
Total interest-bearing assets
|
|
|
82,920,301 |
37,950,657 |
16,559,052 |
24,930,599 |
3,459,972 |
| Interest-bearing liabilities |
|
|
|
|
|
|
|
| Derivative financial liabilities |
32 |
|
60,440 |
60,440 |
|
|
|
| Deposits from customers |
33 |
|
43,305,775 |
35,309,468 |
5,056,932 |
2,872,623 |
66,752 |
| Debt securities issued |
34 |
|
5,092,096 |
- |
1,017,815 |
4,074,281 |
– |
| Other interest-bearing borrowings |
35 |
|
27,505,136 |
11,849,666 |
6,778,018 |
8,877,452 |
|
| Total interest-bearing liabilities |
|
|
75,963,447 |
47,219,574 |
12,852,765 |
15,824,356 |
66,752 |
|
Net interest-bearing assets gap
|
|
|
6,956,854 |
(9,268,917) |
3,706,287 |
9,106,243 |
3,393,220 |
Interest rate sensitivity
The management of interest rate risk against interest rate gap limits is supplemented by monitoring the sensitivity of the Company’s financial assets and financial liabilities to various standard and non-standard interest rate scenarios. Standard scenarios that considered are increase and decrease in interest rate by 100 basis points. This analysis assumes the financial position and performance is constant over the remaining financial year and movement of interest rate is immediate.
|
2021 |
2020 |
|
100 bp |
100 bp |
|
Increase
Rs. |
Decrease
Rs. |
Increase
Rs. |
Decrease
Rs. |
| Sensitivity of projected net interest income |
82,347 |
(82,347) |
69,569 |
(69,569) |
| Sensitivity of reported net assets |
82,347 |
(82,347) |
69,569 |
(69,569) |
C.iV Exposure to currency risk
Currency risk is the risk that the value of financial instruments will fluctuate due to changes in foreign exchange rates and arises from financial instruments denominated in a foreign currency. Intention of managing currency risk is to curtail the currency losses incurred due to foreign currency transactions. CDB oversees the exposure by co-ordinating and being in line with the rates of forex dealing unit. We take initiatives to control the currency stocks in different currencies by exchanging and converting them in the best and a more profitable manner to compose a gain. Future Forex market movements and trends are considered when deciding rates to offer the customers and always intend to maintain in sequence with the Central Bank rate predictions to make the business more competitive.
Foreign currency exposures of the Company is shown below:
| As at 31 March |
2021 |
2020 |
|
|
Amount |
Rate |
Value
Rs. ’000 |
Amount |
Rate
LKR |
Value
Rs. ’000 |
Net exposure Increase/
decrease (%) |
| USD |
198,467 |
197.62 |
39,221 |
176,215 |
187.36 |
33,015 |
19 |
| SGD |
6,415 |
145.62 |
934 |
6,312 |
130.80 |
826 |
13 |
| GBP |
6,488 |
269.88 |
1,751 |
6,339 |
230.01 |
1,458 |
20 |
| EUR |
54,140 |
229.87 |
12,445 |
52,238 |
205.27 |
10,723 |
16 |
| CAD |
14,331 |
155.33 |
2,226 |
14,317 |
131.25 |
1,879 |
18 |
| AUD |
39,618 |
149.43 |
5,920 |
38,034 |
114.19 |
4,343 |
36 |
The Company has obtained foreign borrowings from Belgian Investment Company for Developing Countries (BIO), Nederlandse Financierings-Maatschappij voor Ontwikkelingslanden N.V. (FMO), BlueOrchard Microfinance Fund and Triodos IM. However the Company has entered into forward contracts to cover the exchange rate risk exposed from the above borrowings. (Refer Note 32 and 35)
Exchange rate sensitivity
The management of exchange rate risk by monitoring the sensitivity of the Company’s financial performance to various standard and non-standard exchange rate scenarios. Standard scenarios that considered are increased and decreased in exchange rate by 1% to 5%. This analysis assumes the exchange reserve position is constant over the remaining financial year as well.
Subsequent sensitivity analysis shows changes in LKR, against foreign currencies which would have increased/(decreased) impact to Company’s financial performance.
| As at 31 March |
|
2021 |
2020 |
|
Shock
(%) |
Strengthening
Rs. ’000 |
Weakening
Rs. ’000 |
Strengthening
Rs. ’000 |
Weakening
Rs. ’000 |
| USD |
1 |
392 |
(392) |
330 |
(330) |
| EUR |
1 |
9 |
(9) |
8 |
(8) |
| USD |
3 |
18 |
(18) |
15 |
(15) |
| EUR |
3 |
124 |
(124) |
107 |
(107) |
| USD |
5 |
22 |
(22) |
19 |
(19) |
| EUR |
5 |
59 |
(59) |
43 |
(43) |
C.V Exposure to equity price risk
Equity price risks arises as a result of fluctuations in market prices of individual equities and management conduct mark-to-market calculation on monthly basis and on a need basis to identify the impact.
The following table exhibits the impact on financial performance and net assets due to a shock of 10% on equity price.
| As at 31 March |
2021 |
2020 |
|
Financial assets
measured at
FVTPL/ FVOCI
Rs. ’000 |
Total
Rs. ’000 |
Financial assets
measured at
FVTPL
Rs. ’000 |
Total
Rs. ’000 |
| Market value of quoted equity instruments as at 31 March |
1,629,966 |
1,629,966 |
1,429,503 |
1,429,503 |
Equity price sensitivity
The management of equity price risk is done by monitoring various standard and non-standard equity price scenarios and analysis is given below:
| As at 31 March |
2021 |
2020 |
| Shock Levels |
Impact on
profit
Rs. ’000 |
Impact on OCI
Rs. ’000 |
Impact on
net assets
Rs. ’000 |
Impact on
profit
Rs. ’000 |
Impact on OCI
Rs. ’000 |
Impact on
net assets
Rs. ’000 |
| 10% shock (Increase) |
– |
162,996 |
162,996 |
142,950 |
– |
142,950 |
| 10% shock (Decrease) |
– |
(162,996) |
(162,996) |
(142,950) |
– |
(142,950) |
C.VI Exposure to gold price risk
Gold price risks arises as a result of fluctuations in market gold prices and Management conduct mark-to-market calculation on monthly basis and on a need basis to identify the impact.
| As at 31 March |
Total net weight of
pawning articles
(in Grams) |
Market price
per gram* |
Total market
value
Rs. ’000 |
Gold loan
receivable amount
Rs. ’000 |
Value
excess
Rs. ’000 |
| 2021 |
835,309 |
10,758 |
8,986,660 |
6,893,299 |
2,093,361 |
| 2020 |
755,991 |
9,810 |
7,416,622 |
4,687,708 |
2,728,914 |
* Gold prices were extracted from Central Bank of Sri Lanka
Gold price sensitivity
The following table exhibits the impact on market value of the gold stock held due to a shock of 10% on gold price:
| As at 31 March |
2021 |
2020 |
| Shock Levels |
Impact on
market value
Rs. ’000 |
Impact on
value excess
Rs. ’000 |
Impact on
market value
Rs. ’000 |
Impact on
value excess
Rs. ’000 |
| 10% shock (Increase) |
898,666 |
898,666 |
741,662 |
741,662 |
| 10% shock (Decrease) |
(898,666) |
(898,666) |
(741,662) |
(741,662) |
C.VII Exposure to Government security price risk
Government Security price risks arises as a result of fluctuations in market prices of Government securities and Management conduct mark-to-market calculation on monthly basis and on a need basis to identify the impact.
The following table exhibits the impact on financial performance and net assets due to a shock of 10% on Government Security Price.
| As at 31 March |
2021 |
2020 |
|
Financial Assets
measured at
(FVTPL)
Rs. ’000 |
Other financial
assets
Rs. ’000 |
Total
Rs. ’000 |
Financial Assets
measured at
(FVTPL)
Rs. ’000 |
Other financial
assets
Rs. ’000 |
Total
Rs. ’000 |
| Government securities |
160,639 |
113,660 |
274,299 |
56,442 |
583,200 |
639,642 |
Government security price sensitivity
The following table exhibits the impact on market value of the Government securities held due to a shock of 10% on market price:
| As at 31 March |
2021 |
2020 |
| Shock Levels |
Impact on
profit
Rs. ’000 |
Impact on
OCI
Rs. ’000 |
Impact on
net assets
Rs. ’000 |
Impact on
profit
Rs. ’000 |
Impact on
OCI
Rs. ’000 |
Impact on
net assets
Rs. ’000 |
| 10% shock (Increase) |
2,359 |
– |
2,359 |
6,114 |
– |
6,114 |
| 10% shock (Decrease) |
(2,359) |
– |
(2,359) |
(6,114) |
– |
(6,114) |
Rates on Government securities as per Central Bank of Sri Lanka 2020/21 – during the year
| Shock Levels |
Last traded
rate as at
31 March 2021
% |
Minimum rate
% |
Maximum rate
% |
Last traded
rate as at
31 March 2020
% |
| Treasury Bills |
|
|
|
|
| 91 Days |
5.04 |
4.51 |
6.84 |
7.00 |
| 181 Days |
5.08 |
3.87 |
7.10 |
7.25 |
| 364 Days |
5.11 |
4.13 |
7.40 |
7.50 |
| Treasury Bonds |
|
|
|
|
| 5 Years |
7.08 |
6.57 |
8.75 |
9.27 |
| 8 Years |
7.39 |
7.07 |
8.90 |
9.40 |
D. Capital management
Central Bank of Sri Lanka (CBSL) has introduce a New Capital Adequacy Framework intended to foster a strong emphasis on risk management and to encourage improvements in LFC’s risk assessment capabilities by repealing the earlier Direction No. 02 of 2006.
Under the earlier Direction risk confined only to credit risk and no capital requirements for other risks such as market and operational risk. With the introduction of new capital Adequacy Direction No. 03 of 2018, it provides for maintenance of capital adequacy ratios on a more risk sensitive focus covering credit risk and operational risks under basic approach available in Basel II accord.
The minimum requirement for core capital adequacy ratio and total capital adequacy ratio are 6.5 % and 10.5% respectively for assets less than 100 Bn. LFCs.
The core capital represents the permanent shareholders equity and reserves created or increased by appropriations of retained earnings or other surpluses and the total capital includes in addition to the core capital the revaluation reserves, general provisions/ impairment allowances and unsecured subordinated debts.
The risk-weighted assets have been calculated by multiplying the value of each category of asset using the risk weight specified by the Central Bank of Sri Lanka for credit risk and the basic indicator approach is used for operational risk.
The Company’s policy is to maintain a strong capital base to maintain investor, creditor and market confidence and to sustain the future development of the business. The Company and its individually-regulated operations have complied with all externally imposed capital requirements.
D.I Capital adequacy ratio
|
|
|
2021
% |
2020
% |
| Core capital adequacy ratio (Tier I) |
Core capital |
*100% |
12.10 |
10.25 |
|
Risk-weighted assets |
|
|
|
| Total capital adequacy ratio (Tier I and II) |
Capital base |
*100% |
15.34 |
13.29 |
|
Risk-weighted assets |
|
|
|
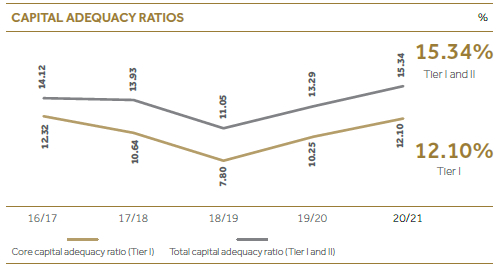
D.II Capital allocation
Management uses regulatory capital ratios to monitor its capital base. The allocation of capital between specific operations and activities is, to a large extent, driven by optimisation of the return achieved on the capital allocated. The amount of capital allocated to each operation or activity is based primarily on regulatory capital requirements, but in some cases the regulatory requirements do not fully reflect the varying degree of risk associated with different activities. In such cases, the capital requirements may be fixed to reflect differing risk profiles, subject to the overall level of capital to support a particular operation or activity not falling below the minimum required for regulatory purposes. The process of allocating capital to specific operations and activities is undertaken independently of those responsible for the operation by Company risk and Company credit and is subject to review by the Company ALCO.
Although maximisation of the return on risk-adjusted capital is the principal basis used in determining how capital is allocated within the Company to particular operations or activities, it is not the sole basis used for decision-making and also taken account of synergies with other operations and activities, the availability of Management and other resources, and the fit of the activity with the Company’s longer-term strategic objectives. The Company’s policies in respect of capital management and allocation are reviewed regularly by the Board of Directors.