CITIZENS DEVELOPMENT BUSINESS FINANCE PLC
ANNUAL REPORT 2020/21


Financial HIGHLIGHTS
| Key performance indicators | 2020/21 | 2019/20 | % |
| Financial performance (Rs. Mn.) | |||
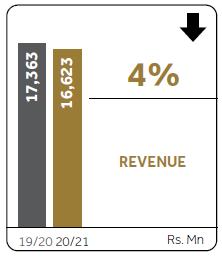
| Gross revenue | 16,623 | 17,363 | (4) |
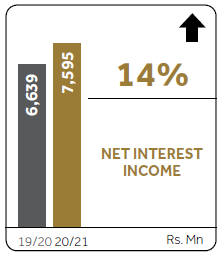
| Net interest income | 7,595 | 6,639 | 14 |
| Net operating income | 7,919 | 6,812 | 16 |
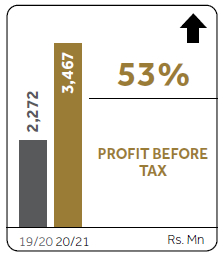
| Profit before tax | 3,467 | 2,272 | 53 |
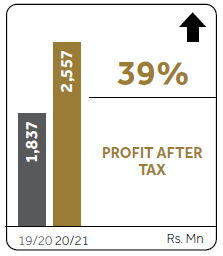
| Profit after tax | 2,557 | 1,837 | 39 |
| Position as at the year end (Rs. Mn.) | |||
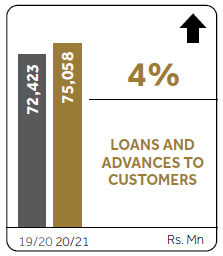
| Loans and receivables to customers | 75,058 | 72,423 | 4 |
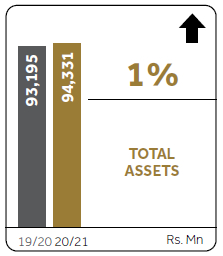
| Total assets | 94,331 | 93,195 | 1 |
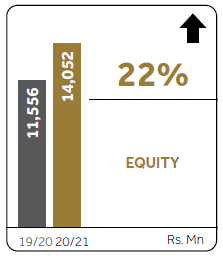
| Total equity | 14,052 | 11,556 | 22 |
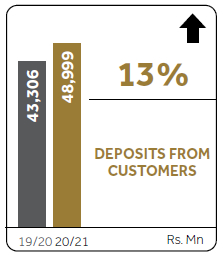
| Deposits from customers | 48,999 | 43,306 | 13 |
| Financial ratios (%) | |||
| Profitability perspective (%) | |||
| Operating profit margin | 24.60 | 15.73 | |
| Net interest margin | 8.10 | 7.17 | |
| Cost to income ratio (Excluding VAT on FS) | 41.00 | 48.79 | |
| Return on average assets (ROA) – after tax | 2.73 | 1.98 | |
| Investor perspective | |||
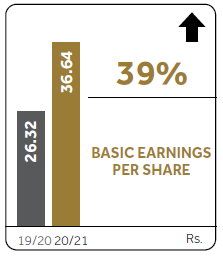
| Earnings per share (Rs.) | 36.64 | 26.32 | |
| Earnings yield (%) | 33.31 | 36.50 | |
| Return on equity (ROE) (%) – after tax | 19.97 | 17.99 | |
| Dividend per share | 7.50 | – | |
| Dividend yield (%) | 6.82 | – | |
| Dividend cover (Times) | 4.89 | – | |
| Dividend payout (%) | 20.47 | – | |
| Net assets value per share (Rs.) | 201.34 | 165.58 | |
| Market value per share – closing – voting (Rs.) | 110.00 | 72.10 | |
| Market value per share – closing – non-voting (Rs.) | 71.90 | 44.80 | |
| Market capitalisation (Rs. Mn.) | 7,283 | 4,750 | |
| Price to earnings (Times) | 3.00 | 2.74 | |
| Statutory ratios (%) | |||
| Capital adequacy | |||
| Tier I (minimum requirement – 5%) | 12.10 | 10.25 | |
| Tier I and II (minimum requirement – 10%) | 15.34 | 13.29 | |
| Statutory liquidity ratio | 14.19 | 15.28 | |
| Non-performing advances ratio (%) | |||
| Gross NPL (Net of IIS) | 7.00 | 7.54 | |
| Net NPL (Net of IIS and provisions) | 2.21 | 4.24 |
Comparative KPIs except the statutory ratios have been adjusted to reflect the effect of amalgamation.
Revenue Rs. 16,623 Mn. |
|
Net profit after tax Rs. 2.6 Bn. |
|
Earning per share Rs. 36.64 |
Total assets Rs. 94.3 Bn. |
|
Loan book Rs.75.1 Bn. |
|
Net assets value per share Rs. 201.34 |